





Fuel station management comes down to a short list of numbers you check every week: fuel margin in cents per gallon for each grade, gallons per day and per dispenser, inventory variance, cash over/short per shift, in-store average ticket and margin. Add a fixed calendar of EPA, OSHA and state compliance tasks. Gas stations earn cents per gallon on large volumes, so small leaks add up: a 3-cent error on 40,000 gallons a month costs $1,200 a month.
The fuel margin is thin. In August 2026, according to the EIA Gasoline and Diesel Fuel Update, distribution and marketing made up 13% of a $4.06 gallon of regular, about 53 cents. That slice has to cover the distributor, the freight, the retailer and the card fees. This guide covers the KPIs, staffing, inventory reconciliation, cash control, purchasing, preventive maintenance and compliance, and ends with a monthly checklist.
The KPIs to review every week
Almost all of them come from three systems you already have: the forecourt controller or POS, the automatic tank gauge (ATG) and the store POS. The job is to pull them into one short report and review it on the same day each week.
| KPI | How to calculate it | Data source | Red flag |
|---|---|---|---|
| Fuel margin (cents per gallon), by grade | Average selling price minus delivered cost per gallon, minus card fees per gallon | Supplier invoices, freight bills, POS fuel report | Falls two weeks in a row while street prices hold |
| Gallons per day, per dispenser, per shift | Meter or POS totals for the period | Forecourt controller | One fueling position far below the others on the same island |
| Inventory variance | Book inventory minus measured inventory, as a share of gallons sold | ATG and delivery tickets | Persistent loss or gain on the same tank |
| Cash over/short | Cash and card totals counted minus POS totals, per cashier and shift | Shift close and processor reports | Repeats on the same shift or with the same person |
| In-store average ticket | Store sales divided by store transactions | Store POS | Drops while pump traffic rises |
| In-store gross margin | (Sales minus cost of goods) divided by sales | POS and invoices | Shrink (theft, spoilage) above last month |
| Pump-to-store conversion | Store transactions divided by fuel transactions | Forecourt controller and POS | Falls after a layout or staffing change |
| Labor cost per 1,000 gallons | Payroll divided by gallons, times 1,000 | Payroll and fuel report | Rises without more volume |
Fuel margin: what public data shows
The EIA breaks the retail price into four parts each month. For August 2026:
| Component | Regular gasoline ($4.06/gal) | Diesel ($5.46/gal) |
|---|---|---|
| Crude oil | 50% | 37% |
| Refining | 24% | 40% |
| Distribution and marketing | 13% | 11% |
| Taxes | 13% | 11% |
Your own margin is a separate calculation. Start with the average price you actually collected (fuel sales divided by gallons, after fleet discounts and loyalty cents). Subtract the delivered cost per gallon: rack or contract price on the bill of lading, plus freight and the taxes on the invoice. Then subtract card fees per gallon. Do it per grade, per week, because prices move fast: in the EIA weekly survey for November 16, 2026, the U.S. average for regular was $3.805, 19 cents below the week before, and on-highway diesel was $5.937, $2.069 above a year earlier. For the full path from gross margin to net profit, read how much a gas station owner makes.
Volume: gallons per day, per dispenser and per shift
Your controller already records sales by fueling position. A position that sells half as much as its neighbor usually points to a bad approach angle, a queue at the entrance or a slow dispenser. Matching sales to the hour shows how many fills each shift handles at peak, and that peak, not the daily average, decides how many people you schedule. To see how island placement changes volume, read our guide on fueling island layout.
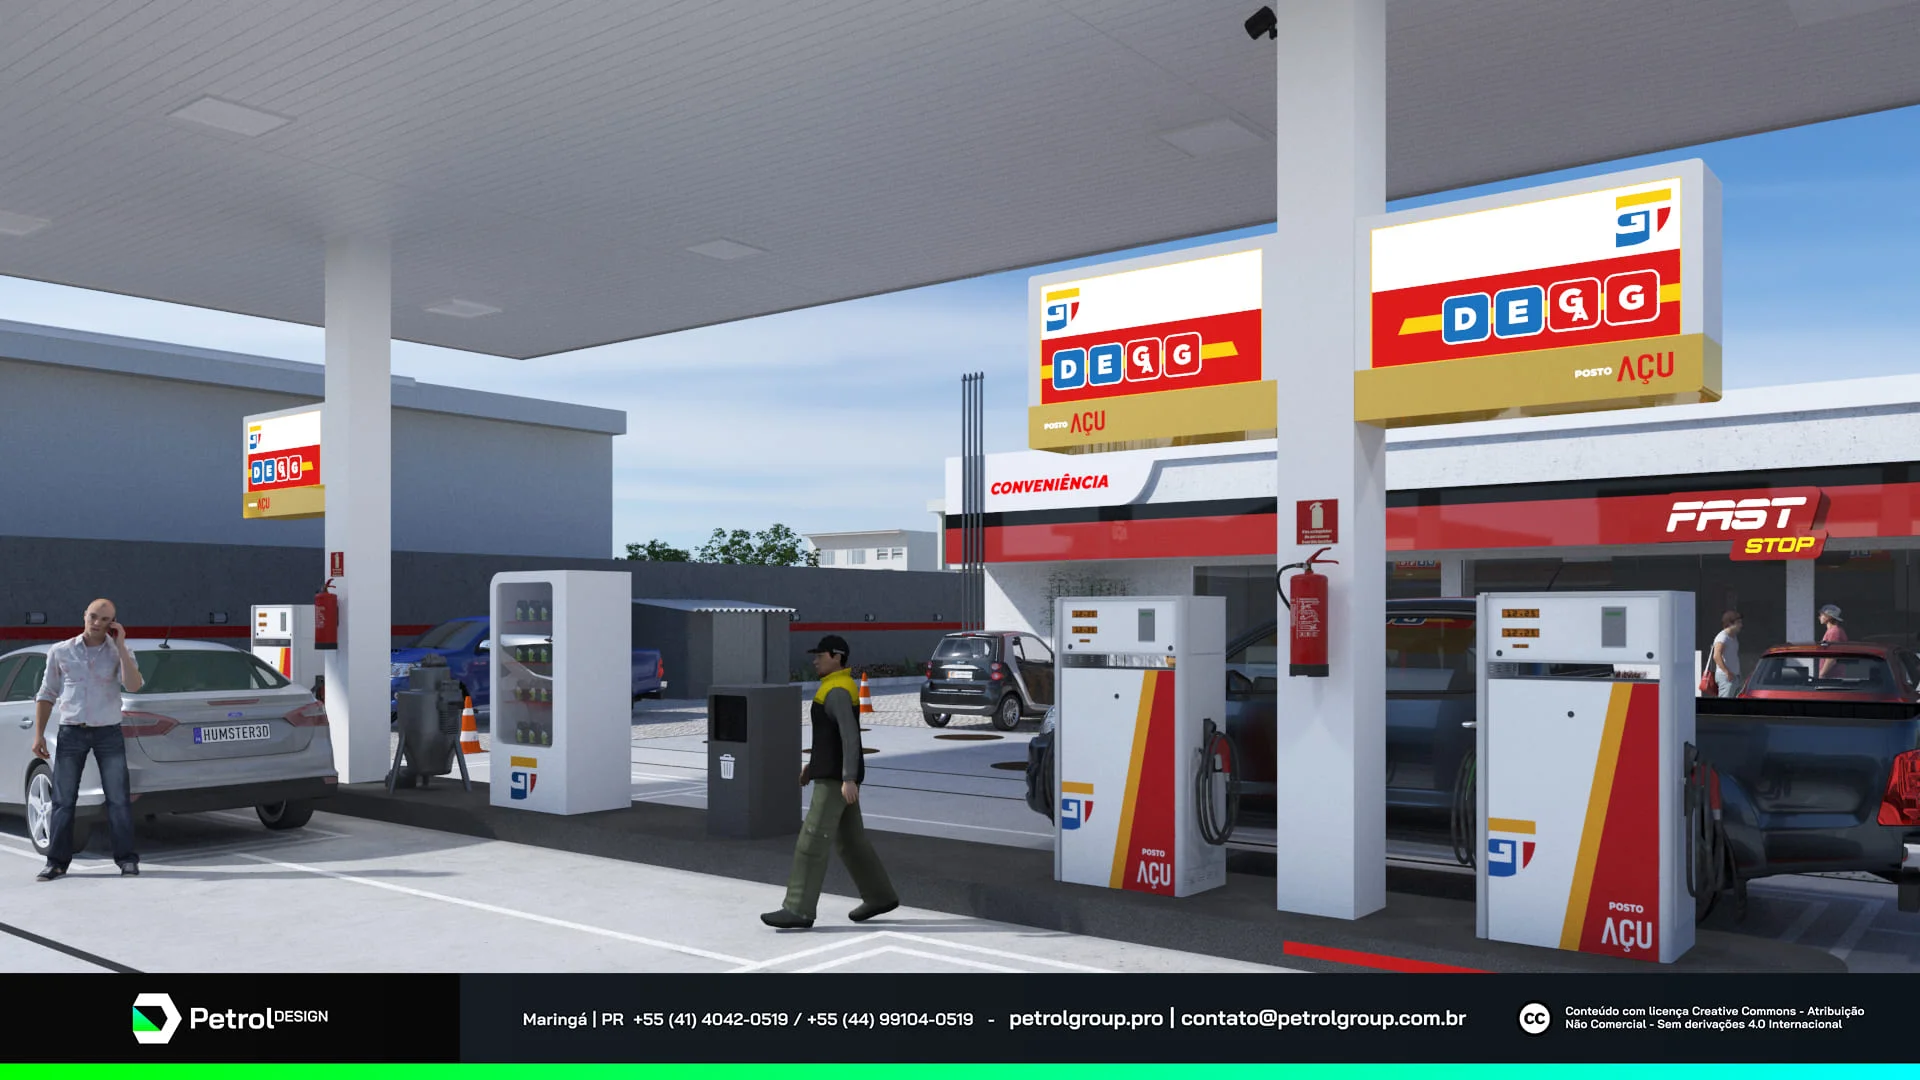
In the Posto Açu layout project in São João da Barra, Brazil, the site plan was drawn to make better use of the available space and improve service flow. A forecourt without bottlenecks shortens every fill, and that shows up directly in gallons per hour.
The c-store: average ticket and margin
The store is where the percentage margin lives. In 2025, fuel was 65.0% of U.S. convenience store sales but only 38.8% of gross profit dollars, according to the NACS State of the Industry data. Foodservice was 28.5% of in-store sales and 38.9% of in-store gross profit. The average store handled 45,160 transactions a month, pump and inside combined, or 1,484 a day.
Three store numbers are enough for a weekly review: average ticket, in-store gross margin and pump-to-store conversion. A low ticket with good conversion calls for higher-value items near the register. Low conversion calls for a better visual link between the canopy and the front door.
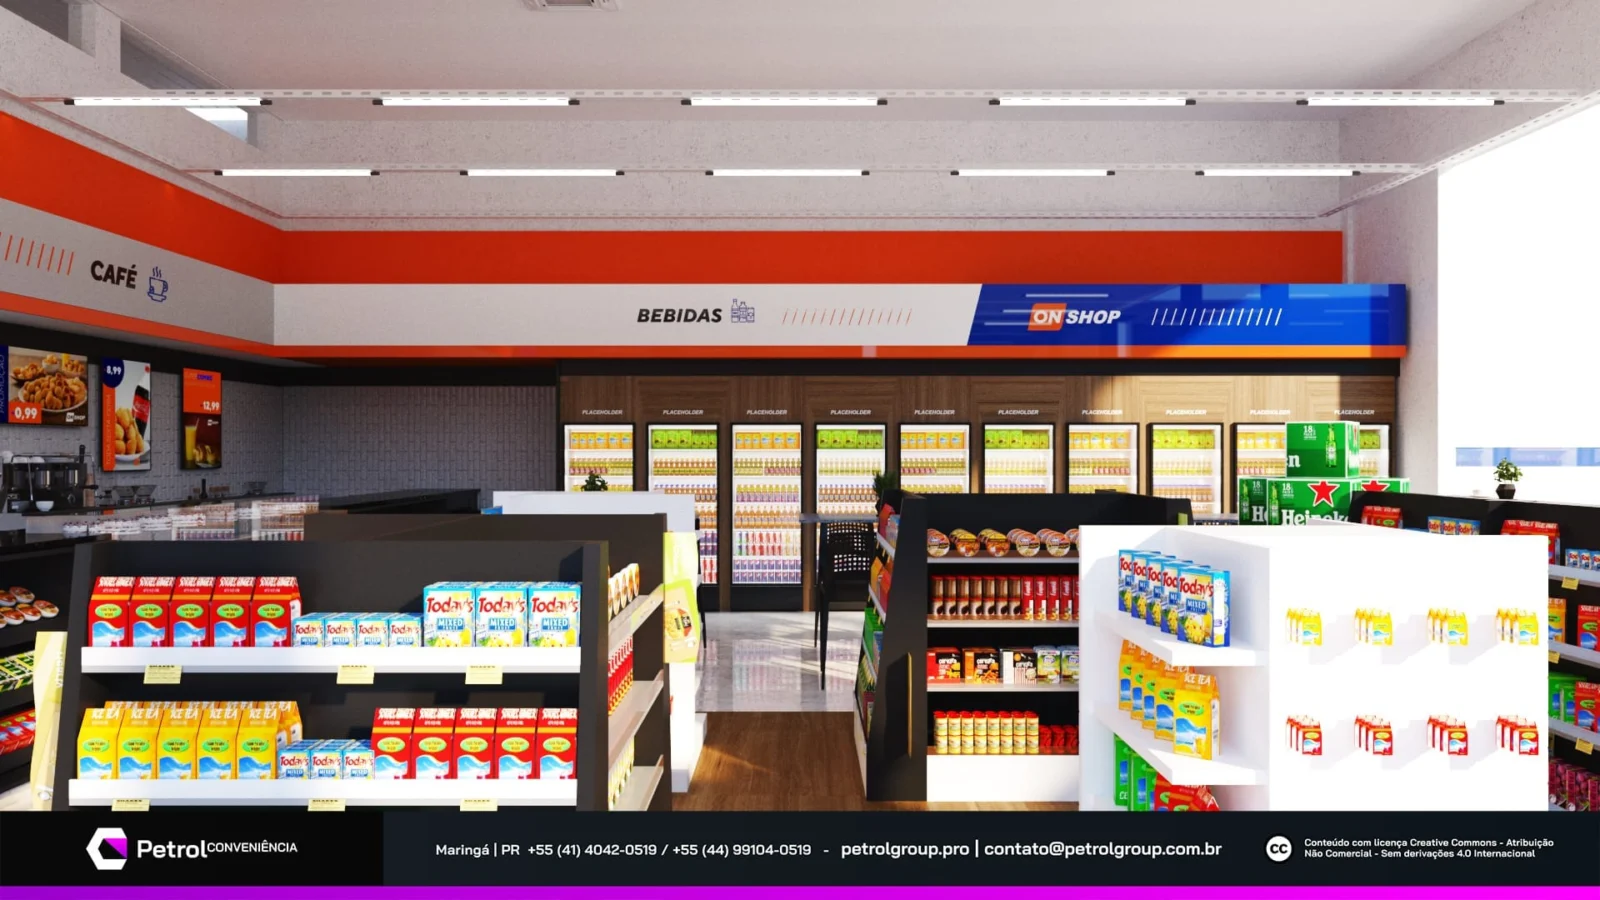
At the On Shop Jardim Ambiental store in Curitiba, Brazil, the gondolas were placed so customers can see the whole store, and the unit focuses on high-turnover products. Store planning is part of Petrol Group’s convenience store design service.
Staffing and scheduling
Gas stations are a large, low-wage employer. In the BLS Occupational Employment and Wage Statistics for May 2025, the gasoline station industry employed 973,720 people. Cashiers were the largest group, with 588,500 jobs and a median wage of $14.68 an hour; first-line supervisors of retail sales workers earned a median of $20.75. NACS reports an average of 19.9 jobs per store and an average hourly wage of $15.04 for store-level associates in 2025.
| Rule or practice | What it means for the schedule | Source |
|---|---|---|
| Overtime | Non-exempt employees earn 1.5 times their regular rate for hours over 40 in a workweek | 29 U.S.C. 207 |
| UST operator training | Every UST facility needs designated Class A, B and C operators; Class C employees handle emergencies and must be trained before taking on those duties | 40 CFR 280, Subpart J |
| Late-night safety | Drop safes, little cash in the register, good lighting and clear sight lines into the store | OSHA 3153 |
| Tobacco and age-restricted sales | Minimum age 21 for tobacco; check photo ID for anyone under 30 | FDA Tobacco 21 |
State law adds rules on breaks, minor labor, predictive scheduling in some cities and final pay, so check your state labor department before you lock the schedule. Build shifts from the fills-per-hour data: the peak of each shift sets the headcount. The person who runs the forecourt, assigns tasks and closes the shift is the forecourt supervisor; our guide to forecourt supervisor duties and pay has the BLS wage data in detail.
Inventory control and reconciliation
Federal UST rules treat inventory as a leak-detection tool, not only a bookkeeping task. Under 40 CFR 280.43(a), inventory control must detect a release of at least 1.0% of flow-through plus 130 gallons each month, and it requires:
- inputs, withdrawals and the amount left in the tank recorded each operating day;
- gauging that reads product level to the nearest one-eighth of an inch over the full height of the tank;
- deliveries reconciled with delivery receipts by measuring the tank before and after each drop;
- deliveries made through a drop tube that ends within one foot of the tank bottom;
- water in the tank bottom measured to the nearest one-eighth of an inch at least once a month.
Inventory control alone is not enough for most tanks. Section 280.41 requires monitoring at least every 30 days with an approved method; tanks installed after April 11, 2016 must use interstitial monitoring, and older tanks can pair inventory control with tightness testing only until 10 years after installation. Release detection results must be kept for at least one year under section 280.45.
| When | What to do |
|---|---|
| Every operating day | Record ATG readings, deliveries and sales by tank; compare book and measured inventory |
| Every delivery | Stick or gauge before and after the drop, match the bill of lading, check for water |
| Every week | Add up the variance by tank and look into any tank that keeps showing the same sign |
| Every month | Close the reconciliation, file the release detection records and the water readings |
When to reorder. The reorder point is average daily sales times the days until delivery, plus a safety buffer. Hypothetical example: a station selling 1,000 gallons of regular a day, with delivery two days after the order and one day of buffer, orders when usable inventory falls to 3,000 gallons. Carrying more ties up cash, and in a falling market you sell at today’s price what you bought at last week’s.
Cash control and shrink
A station has three sources of cash differences: cash, cards and mobile payments. Close by cashier and by shift, not only at the end of the day, and match card batches against processor reports the next morning. A shortage found at month-end no longer has an owner.
Card fees deserve their own line. NACS reports that credit and debit card fees reached a record $21.3 billion for the industry in 2025, while direct store operating expenses rose 4.2%. Divide your monthly fees by gallons sold to see what cards cost per gallon, and use that figure when you set cash and credit prices or negotiate with your processor.
| Difference | Common cause | Control |
|---|---|---|
| Cash short | Wrong change, unrecorded pickups, theft | Timed drops into the safe with a log, small register float |
| Card total short | Sale run on another terminal, voids without approval | One terminal per cashier, manager approval for voids, daily processor match |
| Pump drive-off | Customer leaves without paying | Prepay rules, camera on every position, incident log |
| Fleet charge | Missing signature, plate or driver ID | Fleet card limits and vehicle data in the POS |
Federal and state laws limit what an employer can deduct from pay for register shortages. Write a cash-handling policy, train on it and get legal advice before charging any shortage to an employee.
Fuel purchasing
A branded station buys from its supplier under a supply agreement; an unbranded station can shop rack prices among several suppliers. Either way, purchasing is a weekly decision: compare what you paid per gallon, delivered, against what nearby stations charge and against the trend in the EIA weekly data. Watch payment terms too. If the supplier debits your account before the card processor pays you, the gap comes out of working capital.
- Order by tank, using the reorder point, and confirm the grade before the driver connects.
- Gauge before and after each drop and reconcile the result with the bill of lading, as section 280.43(a) requires.
- Check that spill buckets are clean and dry and that overfill prevention is in place before the drop.
- File the bill of lading with the daily inventory record.
Preventive maintenance
Some maintenance is required by federal rules; the rest protects sales. The table separates the two.
| Item | What to do | How often | Source |
|---|---|---|---|
| Spill prevention equipment | Visual check, remove liquid and debris, check the fill cap | Every 30 days (or before each delivery at sites filled less often) | 40 CFR 280.36 |
| Release detection equipment | Confirm it runs with no alarms and that records are current | Every 30 days | 40 CFR 280.36 |
| Containment sumps and handheld gauges | Visual check for damage and leaks; check sticks and bailers | Every year | 40 CFR 280.36 |
| Release detection components (ATG, probes, sensors, line leak detectors) | Operation test | Every year; keep results 3 years | 40 CFR 280.40(a)(3) and 280.45 |
| Spill buckets and sumps used for interstitial monitoring | Liquid-tightness test, unless double-walled and monitored | At least every 3 years | 40 CFR 280.35 |
| Overfill prevention | Inspection of the shutoff level | At least every 3 years | 40 CFR 280.35 |
| Nozzles, hoses, breakaways, filters | Visual inspection and replacement per manufacturer | Our recommendation: weekly check | Manufacturer’s manual |
| Canopy, fascia, pylon sign, lighting | Lamps, letters, loose panels, gutters | Our recommendation: monthly walk at night | Curb appeal |
For tank and line testing methods, see our guide to tank tightness testing.
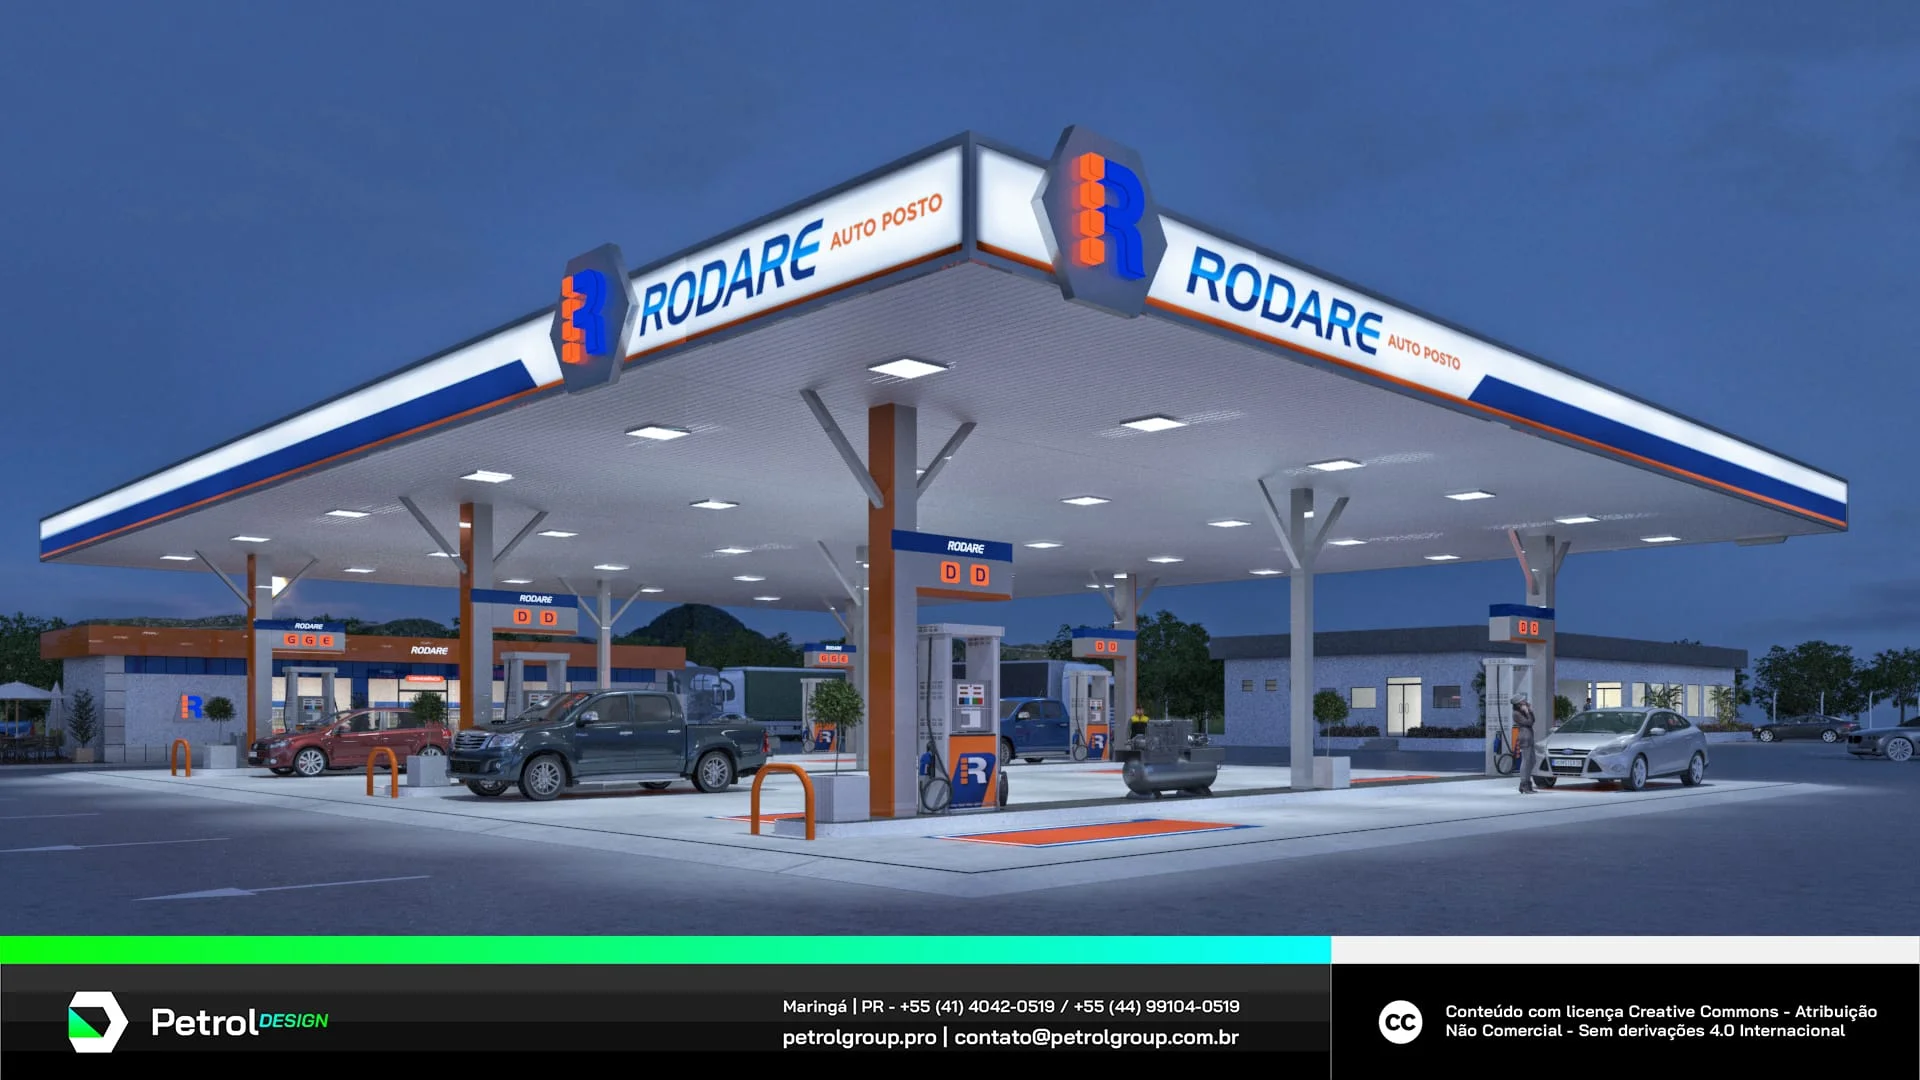
A dark canopy at night loses drivers who never stop. For the Auto Posto Rodare renovation in Coromandel, Brazil, the station had been closed and the owners wanted a complete refresh on a controlled budget. The project used affordable materials and reworked the canopy fascia, the price sign and the store front.
Compliance: EPA, OSHA and state rules
Keep one binder (or one shared folder) with everything an inspector may ask for.
| Obligation | Source | What to keep on file |
|---|---|---|
| Release detection records | 40 CFR 280.45 | Monthly results for at least 1 year; annual operation tests for 3 years |
| Walkthrough inspections | 40 CFR 280.36 | 30-day and annual checklists |
| Spill, sump and overfill tests | 40 CFR 280.35 | Latest test and inspection reports |
| Operator training | 40 CFR 280, Subpart J | Class A, B and C designations and training records |
| Environmental permits | State and local agencies | Current permits and conditions; see our guide to gas station environmental permits |
| Weights and measures | State agency | Dispenser inspection seals and reports |
| Age-restricted sales | FDA and state law | Training records and ID-check policy |
How to grow revenue without a price war
Cutting price is the most expensive lever: every cent comes straight out of margin. Before you touch it, work on four fronts the owner controls.
- A site that reads from the road. Canopy fascia, pylon sign and store front decide whether a driver turns in. The Rodare case shows it can be done on a controlled budget. Petrol Group handles this in its design service.
- A forecourt without queues. More fills per hour at peak are worth more than a promotion. Track it with gallons per shift.
- A store that converts. Ticket, margin and conversion, measured weekly, as in the On Shop example.
- Prices set with the neighbors in view. Petrol Group’s Strategic Insights study analyzes competitors within 5 km (3 miles) of an urban station and 80 km (50 miles) of a highway station, with prices, services and estimated volumes.
Small stations: where the owner wins or loses
At a station with two or three dispensers, the owner usually is the manager, and each fueling position weighs heavily on the result. Focus the week on three numbers: cents per gallon, cash over/short and inventory variance. A lean crew means one absence leaves the register uncovered, so keep a trained backup for every shift. In a small store, a few high-turnover items displayed well earn more than full shelves of slow stock.
Opening or reopening a station: what management inherits
A new owner inherits permits, a supply agreement and UST obligations before selling the first gallon. Buying an existing site also means inheriting its tank history, so ask for the release detection, inspection and testing records before closing. Our guide to how much a gas station costs covers the investment side. After 29 years working only on gas stations, with 983+ projects in 16 countries, Petrol Group’s view is that management starts at the design stage: an oversized or undersized forecourt, tank farm or store becomes a cost every month. More examples are in our portfolio.
Monthly gas station management checklist
- Close the monthly inventory reconciliation for each tank and file release detection records.
- Calculate actual cents per gallon by grade and compare it with the EIA monthly breakdown.
- Compare gallons per day, per dispenser and per shift with last month and the same month last year.
- Add up cash over/short by cashier and shift; match card batches and fees with processor statements.
- Store: average ticket, gross margin, pump-to-store conversion, slow movers and spoilage.
- Payroll: overtime hours and next month’s schedule built from peak fills per hour.
- Purchasing: average delivered cost against street prices and the EIA weekly trend; payment terms.
- Walkthrough: 30-day checks of spill buckets and release detection; nozzles, hoses and breakaways.
- Calendar: dates for the annual operation test, the 3-year spill and overfill checks and permit renewals.
- Training: new hires trained as Class C before taking on those duties; age-restricted sales refreshers.
- Curb appeal: canopy, pylon and store front lighting checked at night.
- Competition: prices at nearby stations and any adjustment to your strategy.
If you want help setting up these numbers, or deciding on a renovation, expansion or rebrand, see Petrol Group’s gas station consulting.
Frequently asked questions
What is a typical gas station fuel margin per gallon?
Public data does not isolate the retailer’s margin. The EIA shows distribution and marketing at 13% of a $4.06 gallon of regular in August 2026, about 53 cents, which covers distributors, freight and retailers together. Your own margin comes from your invoices: average price collected minus delivered cost and card fees.
Which KPIs should a gas station manager track?
Cents per gallon by grade, gallons per day and per dispenser, inventory variance by tank, cash over/short by cashier, in-store average ticket and gross margin, and labor cost per 1,000 gallons. Review them weekly, on the same day.
How often must a gas station reconcile fuel inventory?
Where inventory control is part of release detection, 40 CFR 280.43(a) requires readings each operating day and a monthly reconciliation that can detect 1.0% of flow-through plus 130 gallons. Most tanks also need a monthly monitoring method such as interstitial monitoring or an ATG test.
How much of a c-store’s profit comes from fuel?
For the U.S. industry in 2025, NACS reports fuel at 65.0% of sales but 38.8% of gross profit dollars. The store, led by foodservice, brought in the rest, which is why weekly store KPIs matter as much as fuel KPIs.
What UST inspections are required every month?
Under 40 CFR 280.36, a walkthrough every 30 days checks spill prevention equipment and release detection equipment and its records. Containment sumps and handheld equipment are checked yearly, and spill and overfill equipment has 3-year test and inspection cycles under 280.35.
How many employees does a gas station need?
NACS reports an average of 19.9 jobs per convenience store in 2025, but your number depends on hours, store size and foodservice. Schedule from fills per hour at each shift’s peak and from store transactions, not from the daily average.
How can a small gas station increase revenue?
Shorten queues at peak, make the canopy and price sign visible at night, and track store ticket and conversion weekly. Check competitors’ prices before cutting your own, since every cent off comes straight out of the margin.